

northlandiguana@gmail.com
3210 Devonshire St.
Duluth, MN 55806
Carl M. Sack
Geographer, Cartographer, Educator

Welcome to my website. A little bit about me: I make maps. I teach. I enjoy being in nature, exploring new places, and building community. I like to eat good food and read good books that make me think. I am a justice seeker looking for ways that mapping can empower the marginalized and oppressed in society. I am a husband and a father of two beautiful children. Of my many useful skills and likeable attributes, I believe the most important is that I am a life-long learner, which entails a constant search for new knowledge and skills and teaching others what I know.
"In every outthrust headland, in every curving beach, in every grain of sand there is the story of the earth."
-Rachel Carson
Click each thumbnail tile to open a pop-up window with a full-extent sample of the work. Some pop-ups include a slideshow with multiple maps. All work on this page is authored by Carl Sack and licensed Creative Commons (CC-BY-SA) unless otherwise noted.
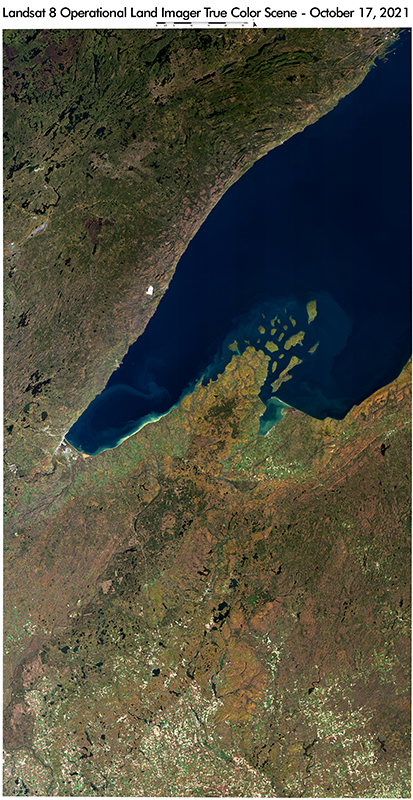
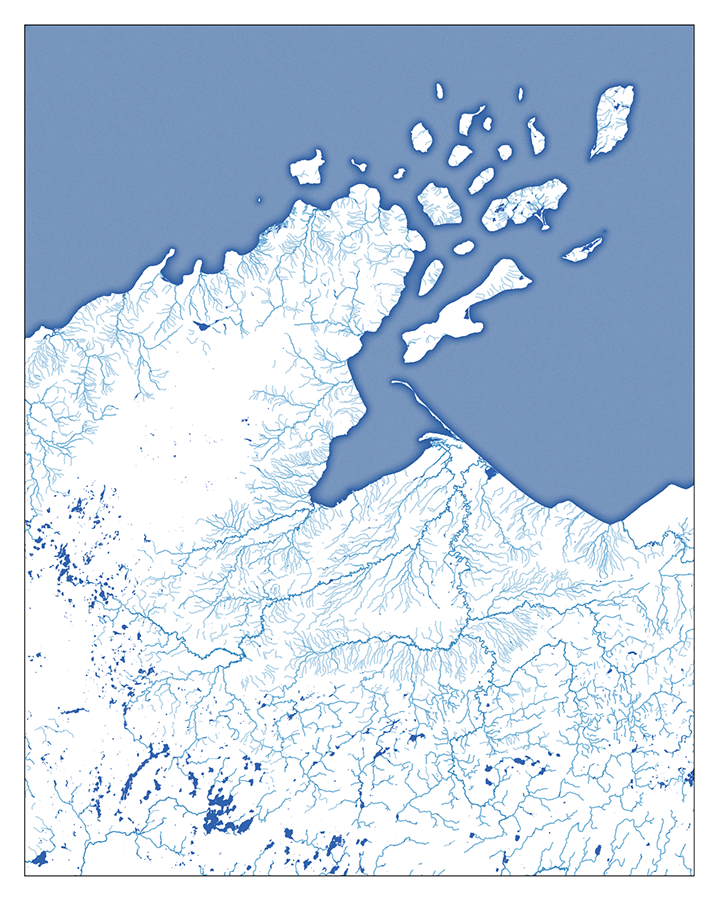
Landsat 8 Poster: Sometimes the most breathtaking maps are the simplest. On October 17, 2021, the Landsat 8 satellite swept across Path 26 on a rare almost completely cloudless day across the western Lake Superior region. I mosaicked two adjoining scenes and performed color adjustments in ArcGIS Pro and Photoshop to create this door-sized strip poster capturing the progression of autumn from Bloomer and St. Croix Falls to the Canadian border. From the swirling sediments and miniscule ore ships on Lake Superior to the coppery patchwork of forest, pine plantation, and farms, to the knobby hills and lake-studded striations left behind by the Laurentide ice sheet, the fantastic carpet of textures in this image reveals the incredible wonder of the area I call home. Click here for a larger image. Contact me for the full resolution file.
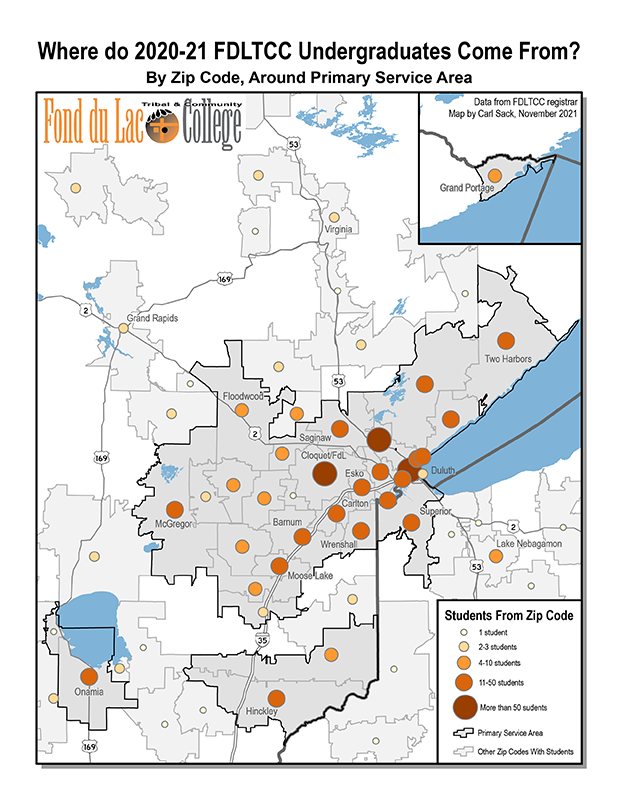
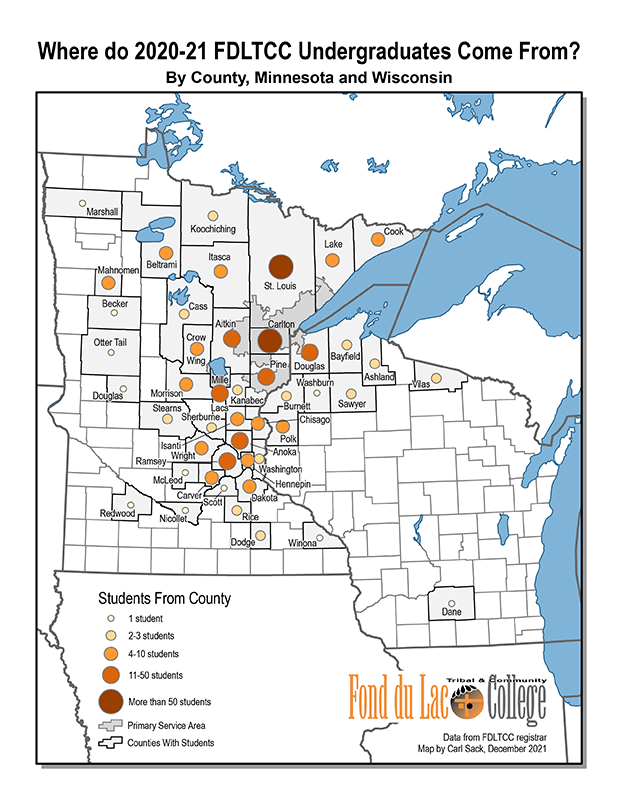
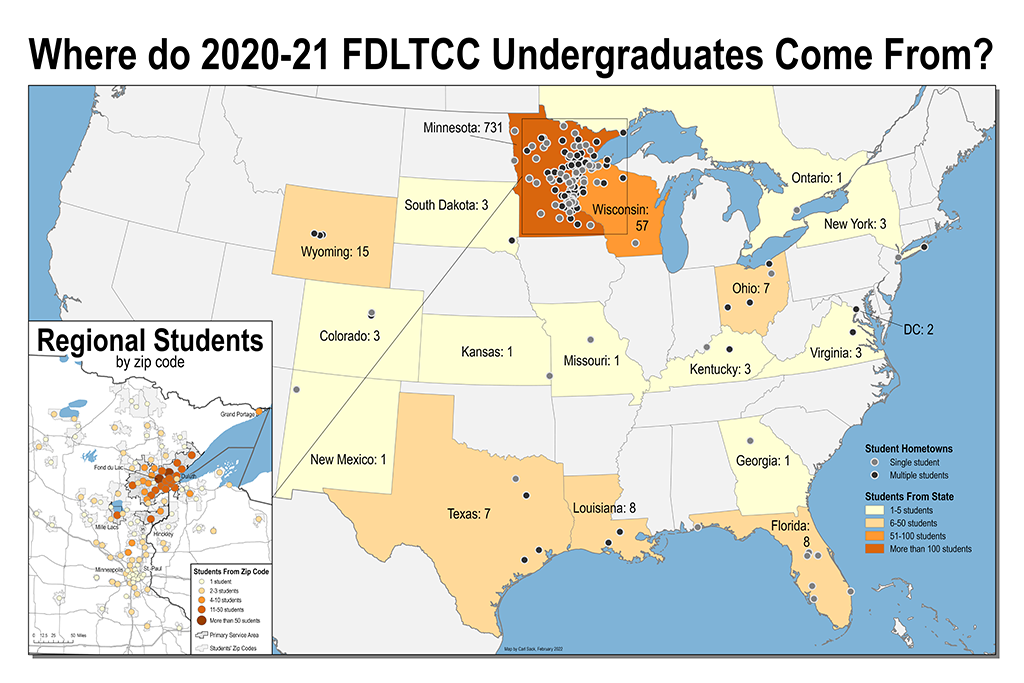
Where Do FDLTCC Undergraduates Come From?: As GIS Program Coordinator at Fond du Lac Tribal and Community College, most of my energy goes toward teaching and advising students on their GIS projects. However, sometimes I am asked to put my own map-making skills to use in service of my institution. This annual patial analysis and mapping of our student body assists with marketing and promotion and shows just how wide an impact we have on the region.
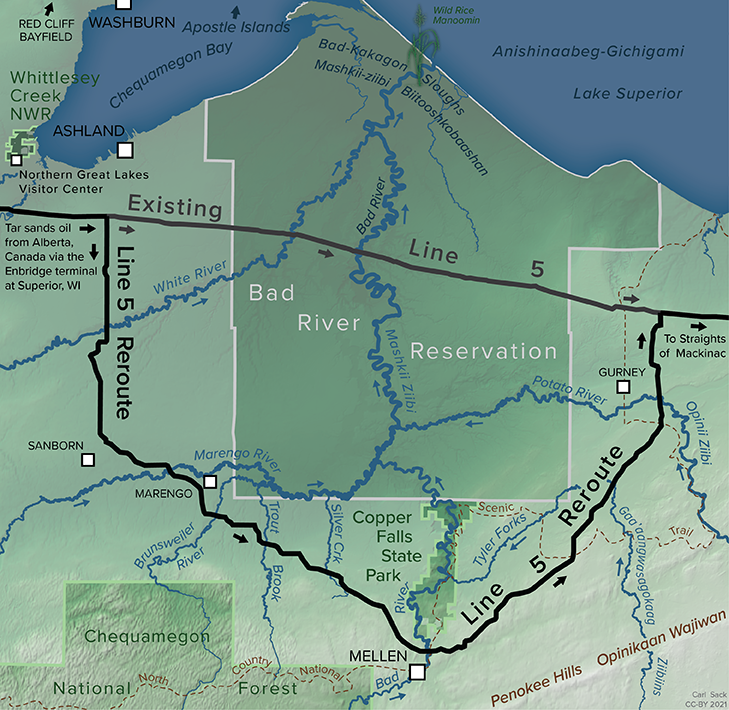
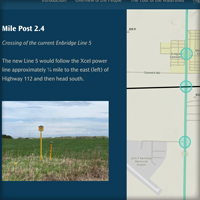
Line 5 maps: Line 5 is an Enbridge oil pipeline that crosses northern Wisconsin and the length of Michigan, carrying crude oil from northern Alberta to Sarnia, Ontario under the Straits of Mackinac. The line has been challenged for the danger it poses to lakes Michigan and Huron at the Straits. The Bad River Band of Ojibwe have demanded that Enbridge remove the pipeline, which it has been operating without a legal easement across tribal property since 2013. Enbridge is seeking to reroute the pipeline through the headwaters of the Bad River Watershed as the Band's case against them proceeds through court.
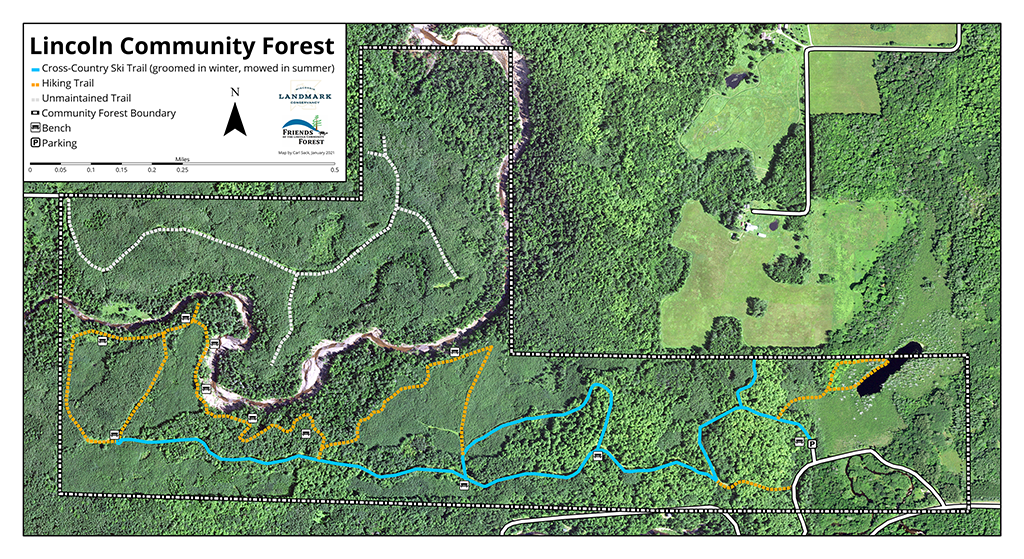
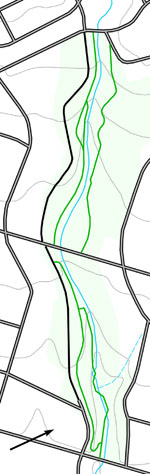
Lincoln Community Forest Trail Map: I still love trail maps. This was a simple trailhead kiosk map I created for a community organization in Bayfield County, Wisconsin. Normally I steer clear of imagery backgrounds, but given the active forest management in this parcel, adding the digitized lines atop recent USDA NAIP imagery seemed appropriate.
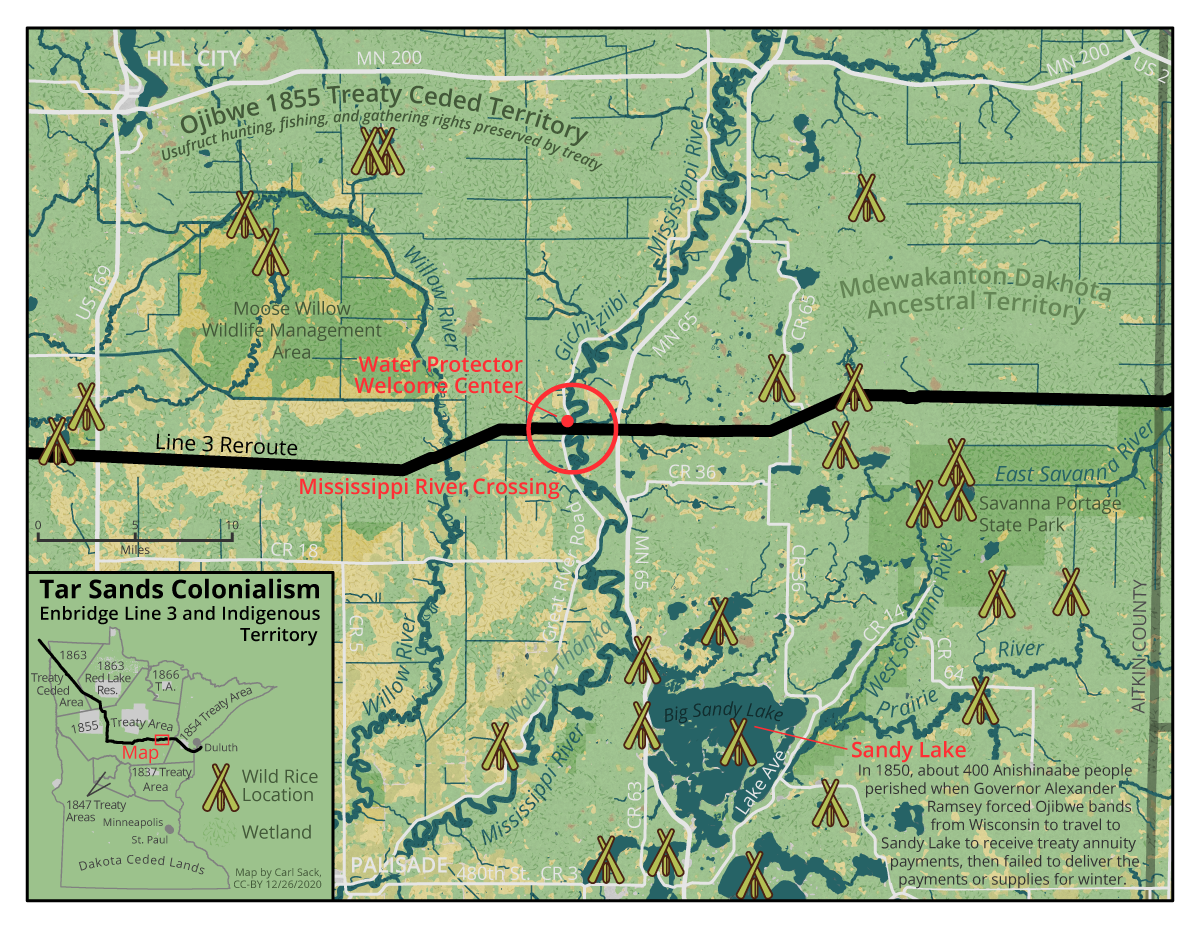
Tar Sands Colonialism: Enbridge Line 3 and Indigenous Territory: Enbridge Energy's Line 3 pipeline replacement project doubled the flow of tar sands oil through what had been an aging pipeline across Ojibwe treaty territory. The company paid regional law enforcement agencies to counter stiff resistance from Indigenous water protectors and allies. The pipeline ultimately resulted in 28 frack-outs releasing toxic drilling mud into waterways and three confined aquifer breaches. This map was designed during the early days of civil disobedience to show the Water Protector Welcome Center at the pipeline's lower crossing of the Mississippi River and wild rice lakes endangered by the project.
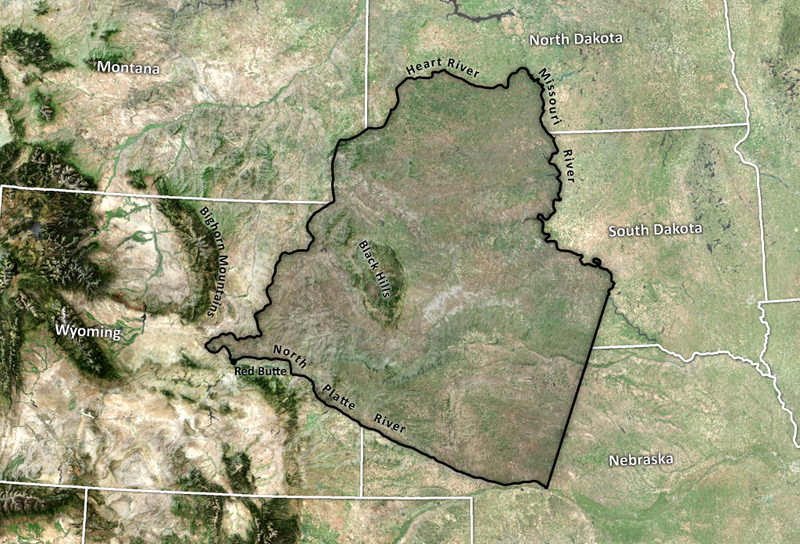
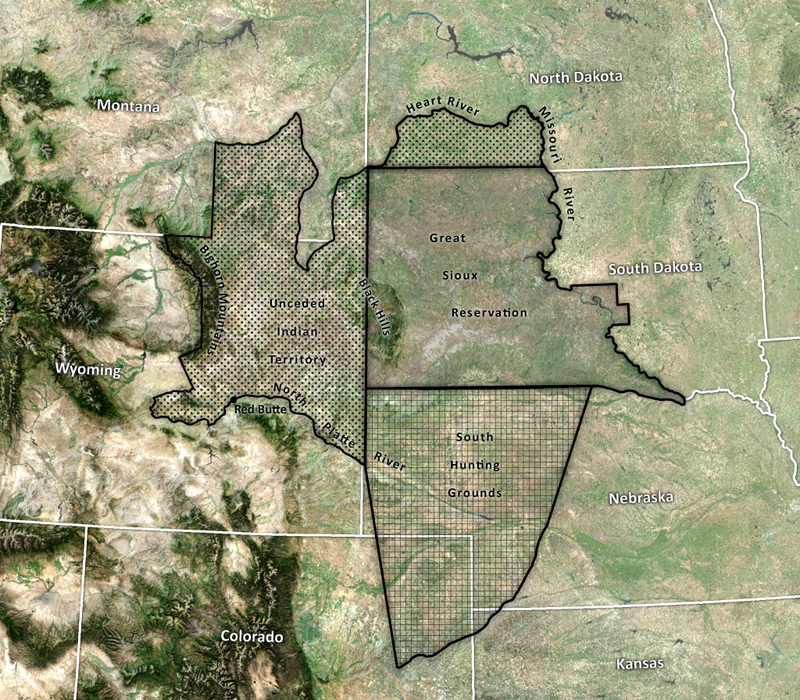
Invisible Nation: Mapping Sioux Treaty Boundaries: This was a series of maps I put together showing the boundaries of Sioux Territory as defined by the peace treaties of 1851 and 1868 and interpreted by the Indian Claims Commission in the 1960s and 70s. These maps involved experimenting with adding sattelite imagery to shaded relief. I detail my research process and design choices in this blog post.
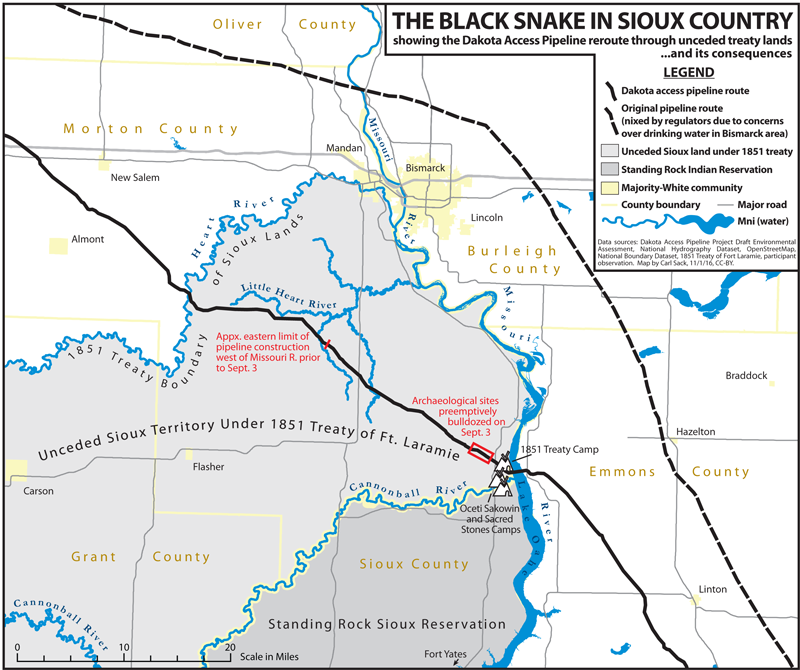
The Black Snake in Sioux Country: I made this map to show the geography of the 2016 struggle of the Standing Rock Sioux Tribe and their allies against the Dakota Access Oil Pipeline in North Dakota. The map highlights the reroute of the pipeline corridor to avoid potential water contamination in majority-white communities while putting Native American communities at greater risk, along with the locations of resistance camps and where the pipeline company preemptively bulldozed an area containing archaeological sites to avoid a court-ordered halt to construction. My full statement on the map is available here.
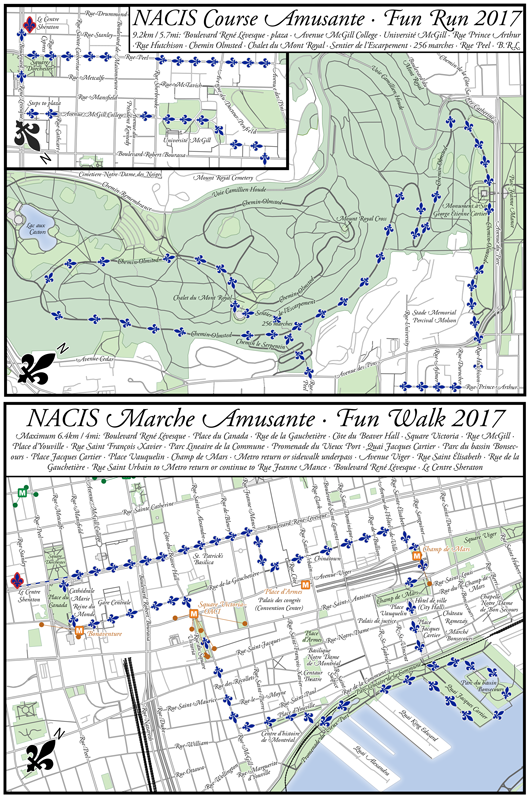
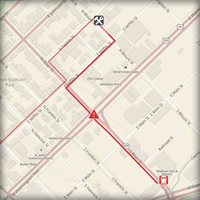
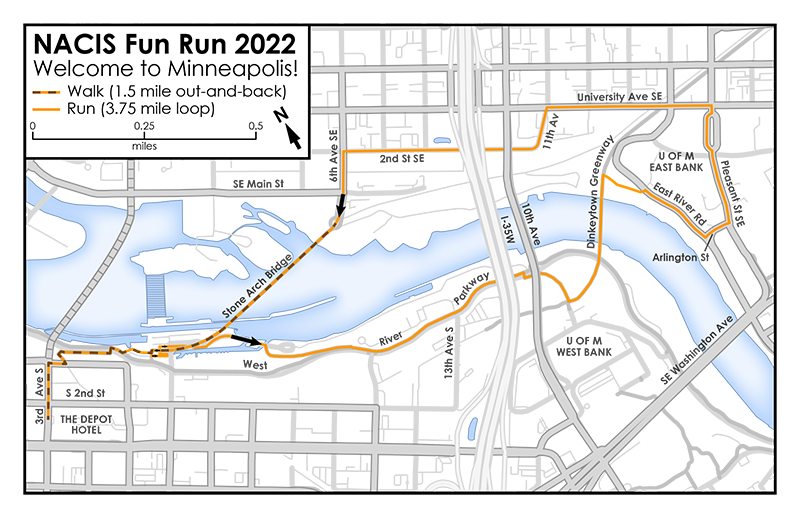
NACIS Fun Run maps: I can't sit still at conferences for multiple days on end without some exercise, and what better way to see a host city than on foot? I started planning the Fun Run for the North American Cartographic Information Society (NACIS) conference in 2015. Each running route at a cartography conference needs a map, of course. Here are a couple of them.
Maps for Capitalism, Nature, Socialism: I create about one map every two months pertaining to an environmental justice issue on contract for the peer-reviewed journal Capitalism, Nature, Socialism.
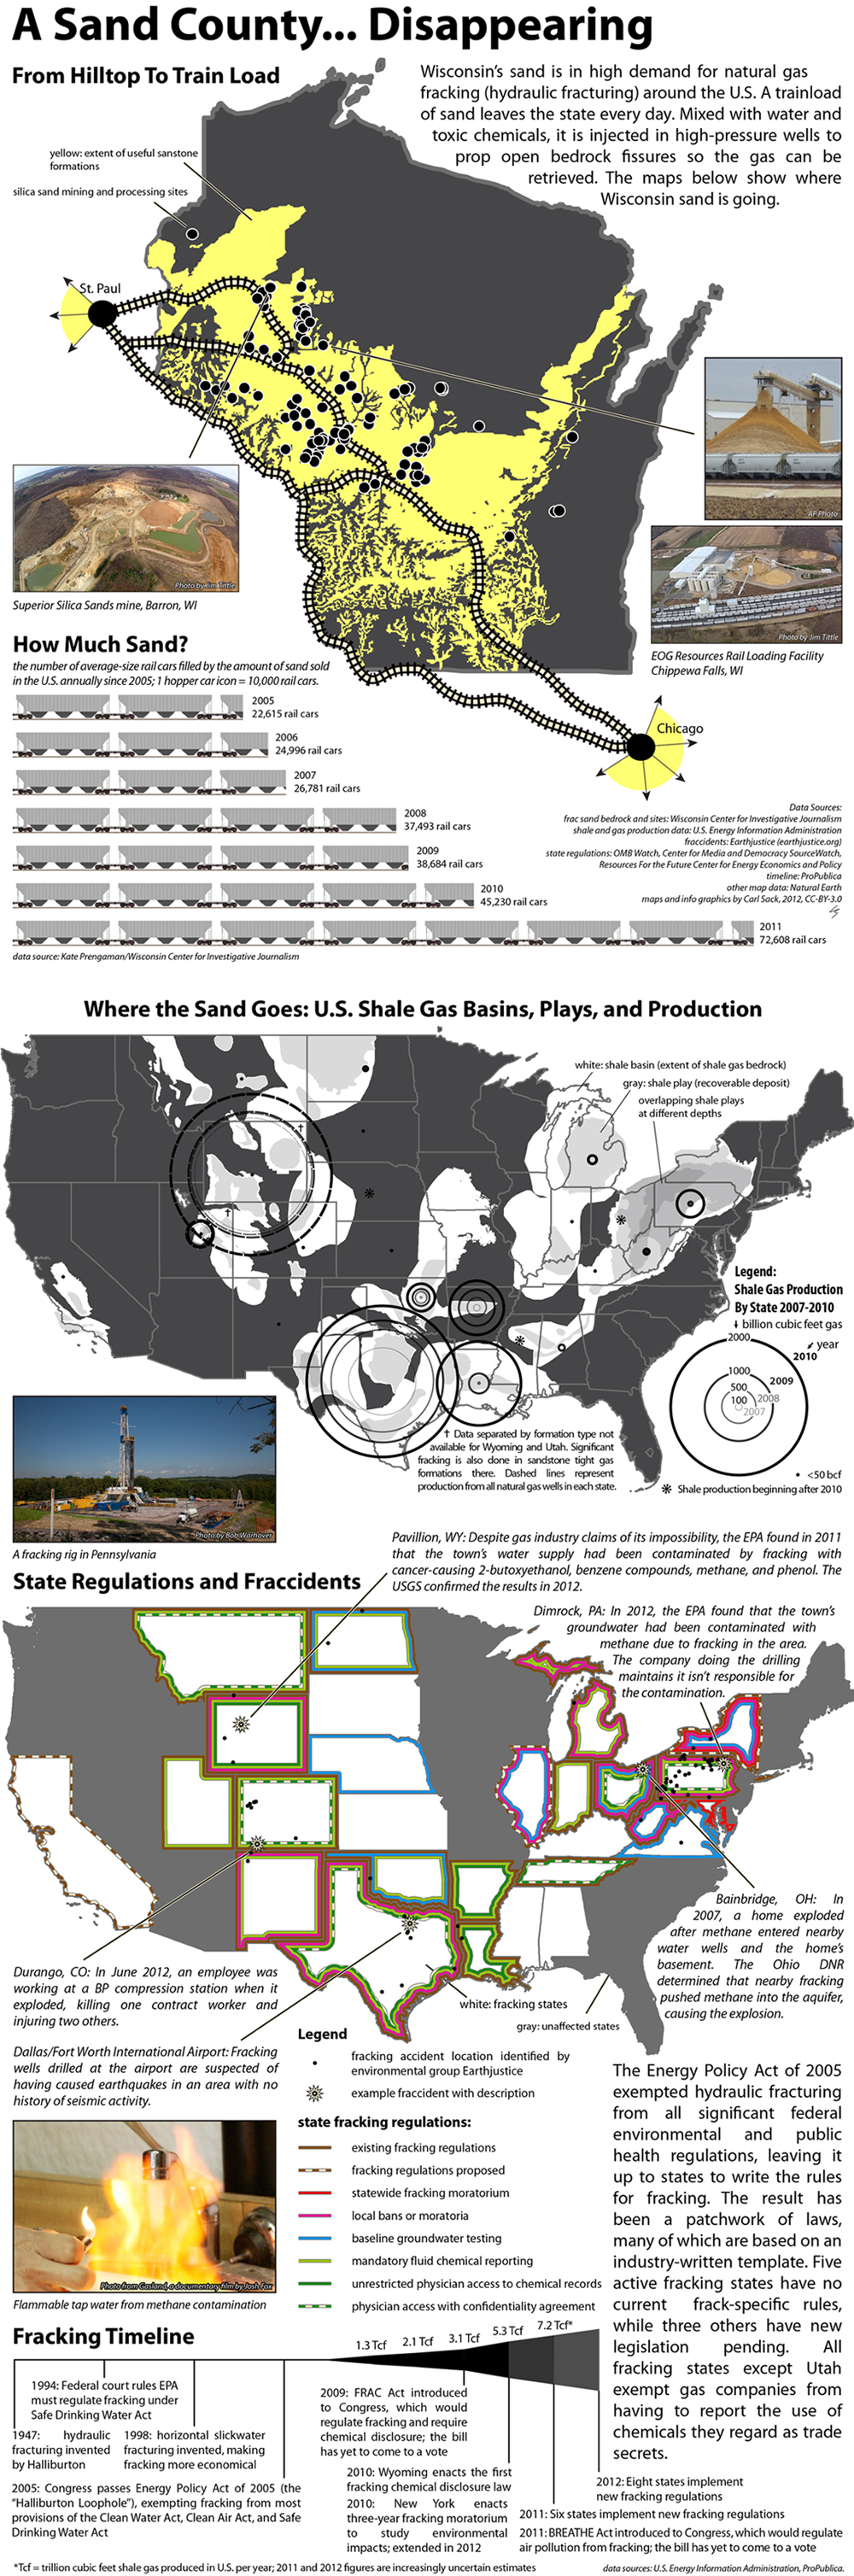
A Sand County Disappearing: Frac sand mining has exploded in Wisconsin over the past two years, raising concerns about air and groundwater pollution in the western part of the state. Of even greater concern is where the sand goes: it's fueling a boom in hydraulic fracturing or fracking, a natural gas extraction technique that has contaminated drinking water supplies with methane and a soup of cancer-causing chemicals. (view small)
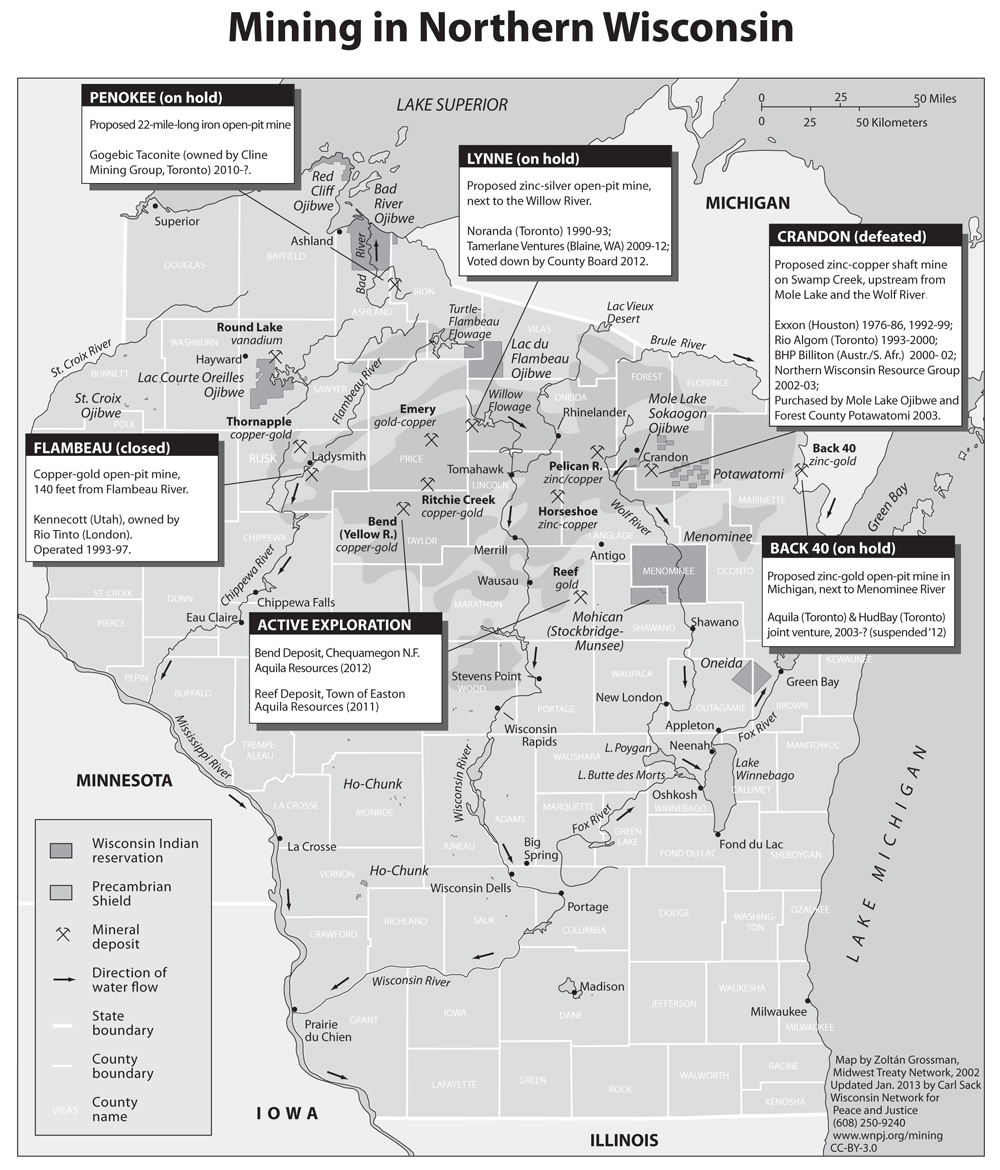
Mining In Northern Wisconsin: In 2002, another UW Geography grad student, Zoltán Grossman, created a map showing all of the active prospects for mines in the northern part of the state. Mining is once again a hot-button political issue, so I decided that an updated version of Zoltán's map would be a useful information resource for the concerned public. We worked together to update and distribute the map, keeping the original black-and-white design for simplicity and reproduceability.
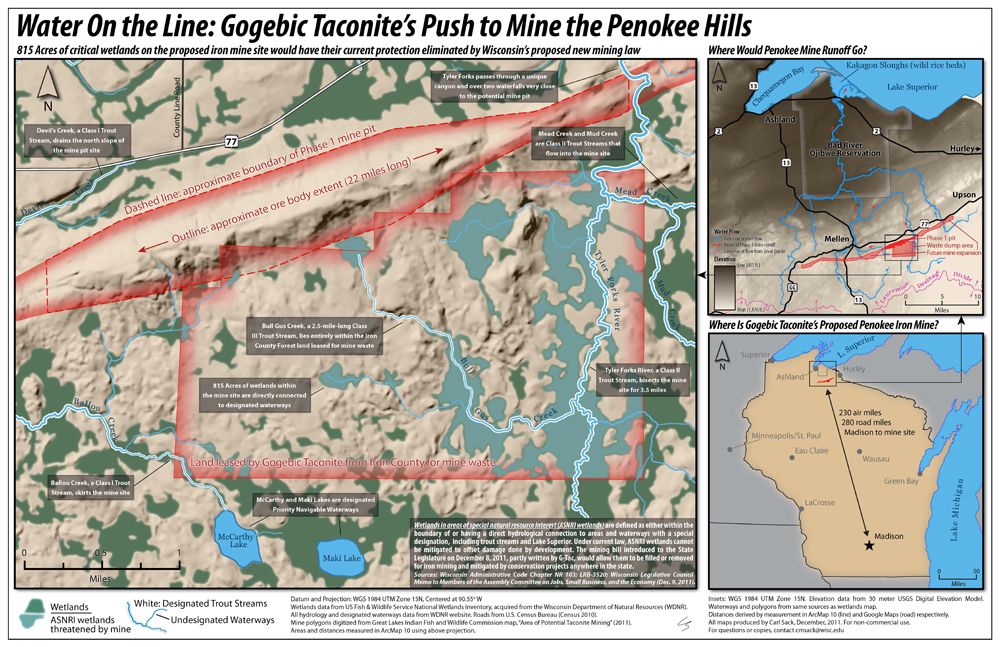
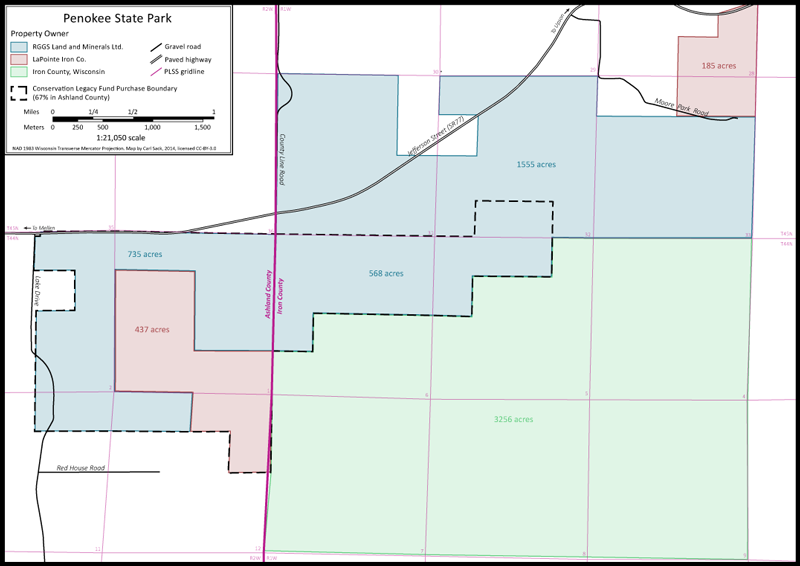
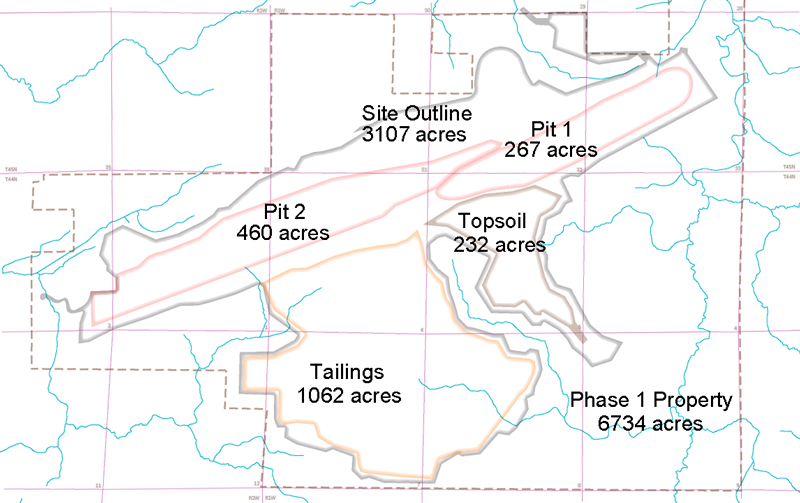
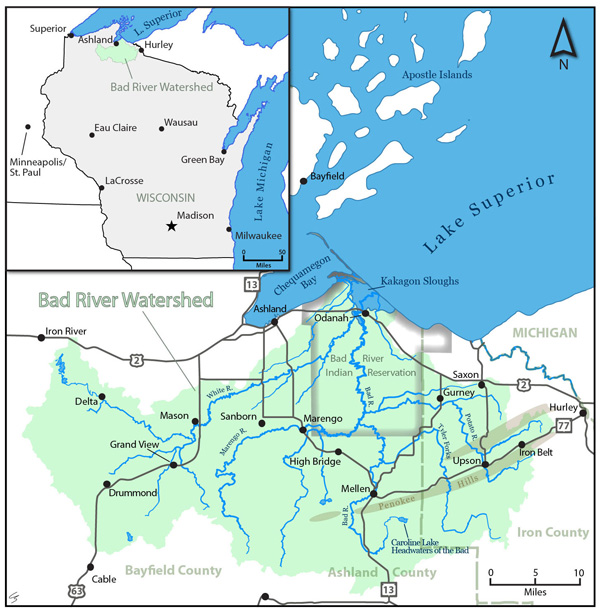
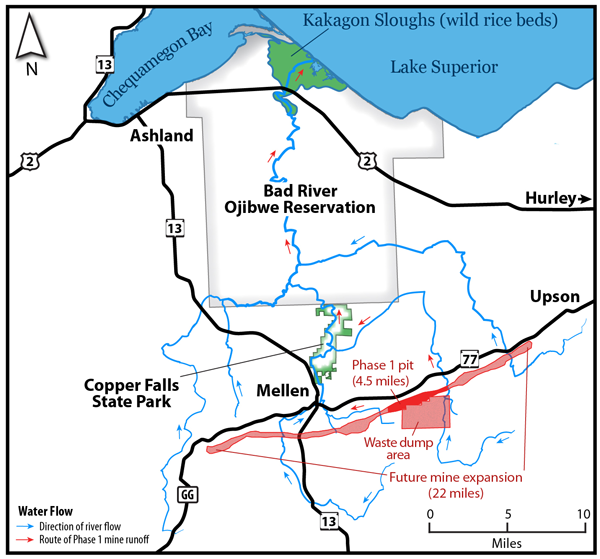
Water On the Line: I believe in using maps to advocate for communities and the environment. My map of the proposed Penokee Mine site in northern Wisconsin was reprinted hundreds of times and used by legislators, local residents, and environmental activists around the state.
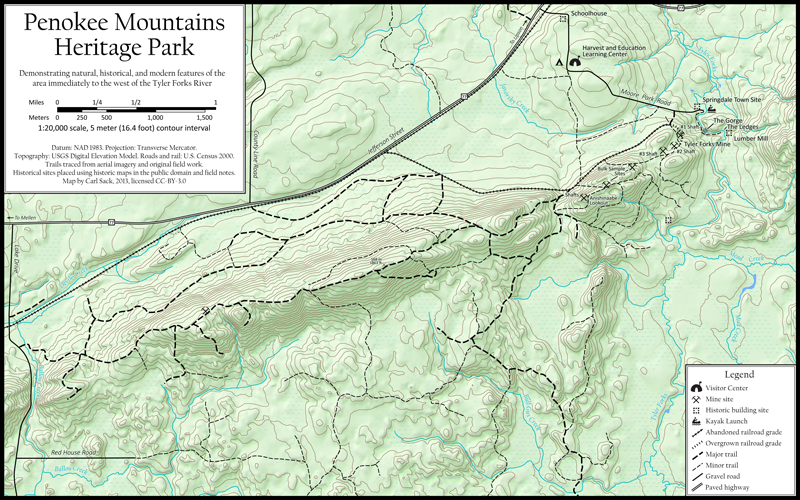
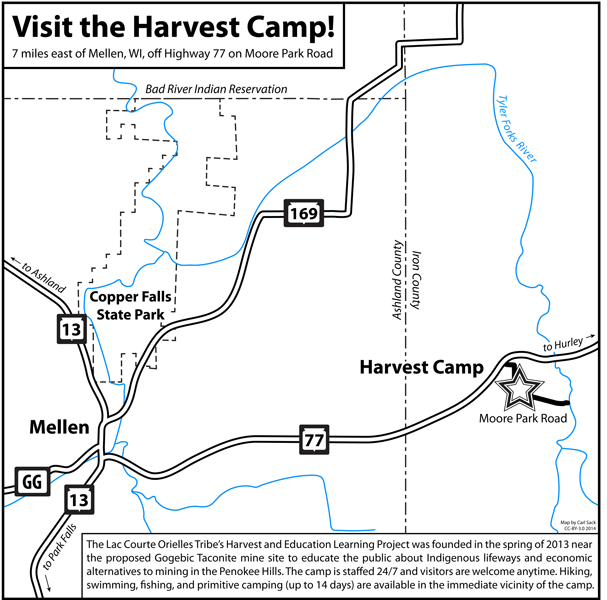
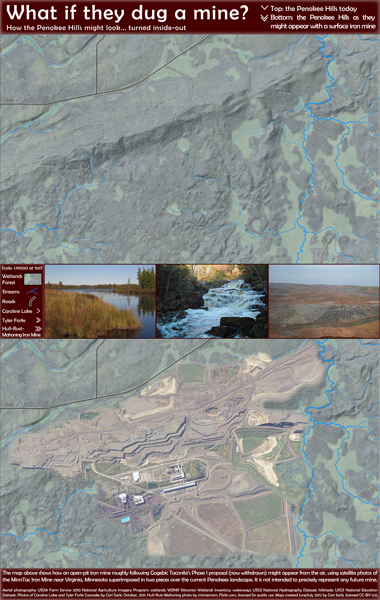
Other Penokee Maps: Between 2012 and 2014 I made a number of maps of the Penokee Hills and Bad River Watershed, both for public use and for activists seeking a better understanding of the scope of the proposed mine. Although less widely distributed than Water on the Line, many of these maps were nonetheless used by many and had an impact on the struggle. The Penokee Mountains Heritage Park map in particular was an imaginative collaboration with the Lac Courte Orielles Tribe's Harvest and Education Learning Project to envision what kind of cultural, economic, and recreational resource the Penokee Hills could be if preserved for future generations.
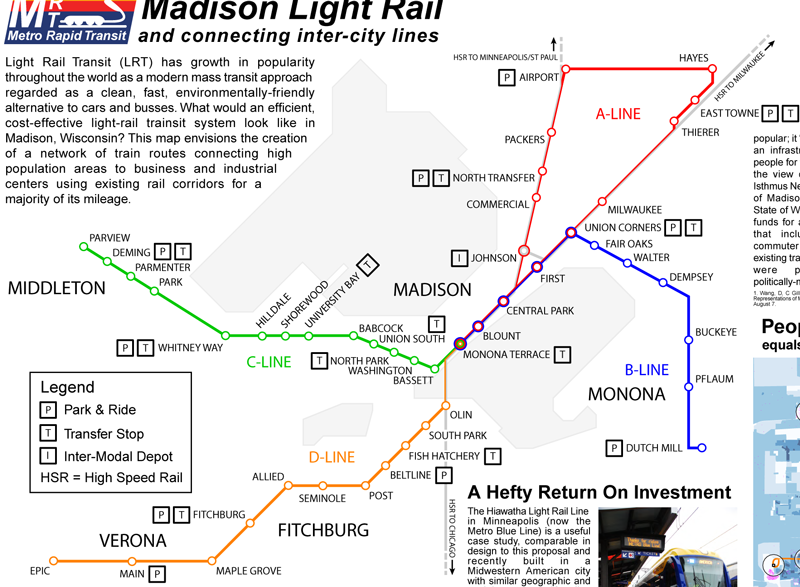
Madison Light Rail: What if Madison, Wisconsin had a light rail transit network? What would such a network look like if developed cost-effectively, using mostly existing rail corridors? What benefits could it bring to workers, commuters, and the local economy? I became curious about these questions and decided to pursue them through an independent mapping, spatial analysis, and info graphic project over the summer of 2014.
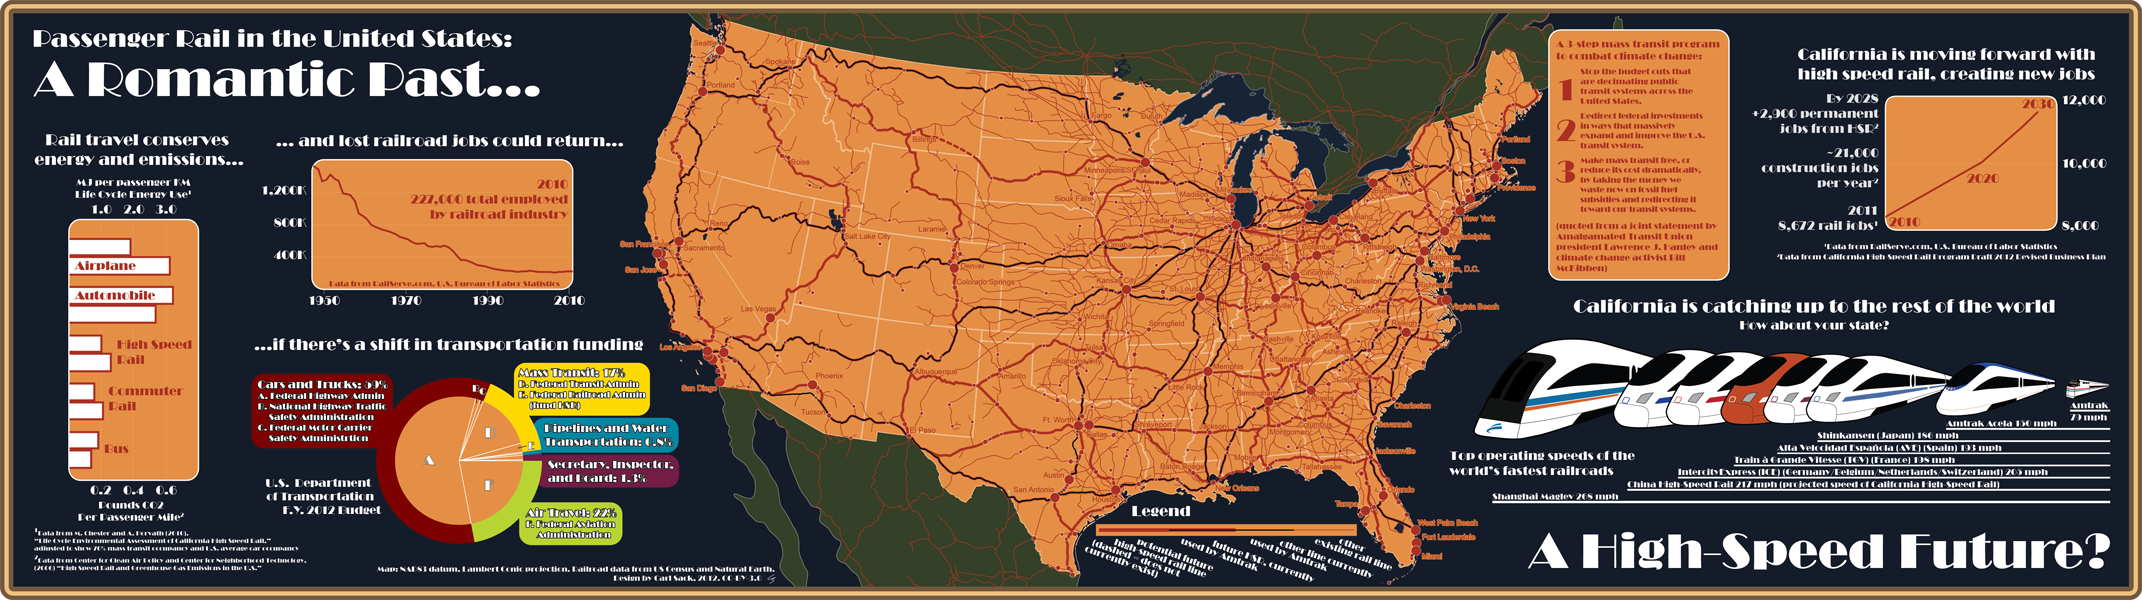
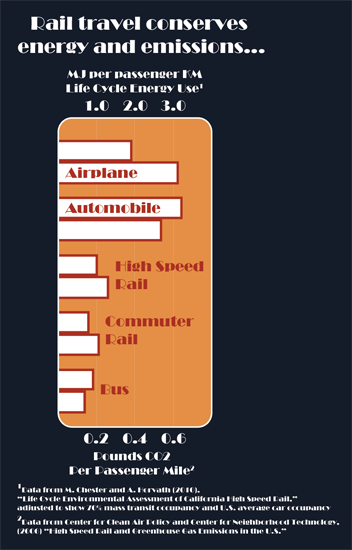
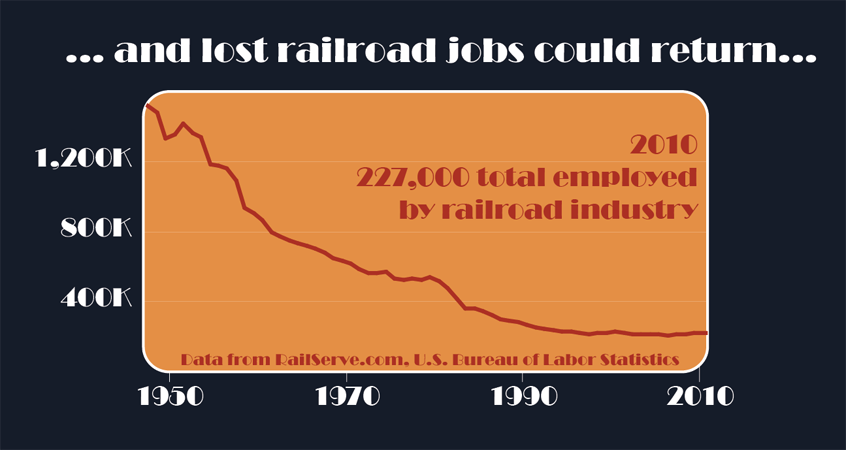
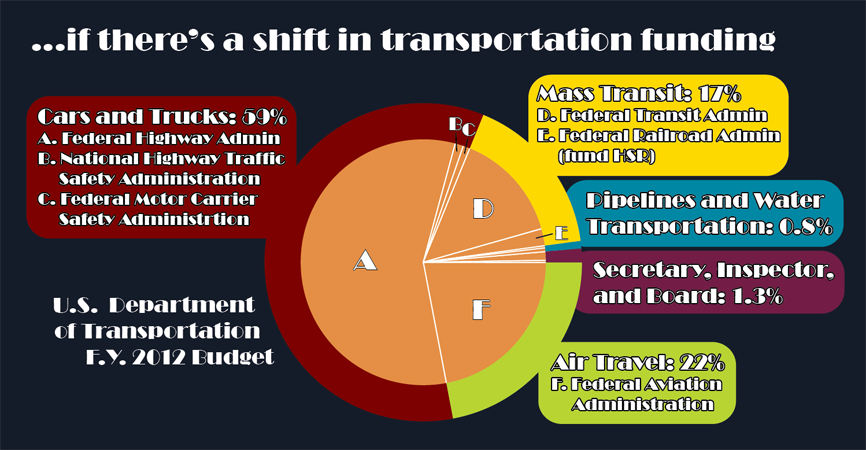
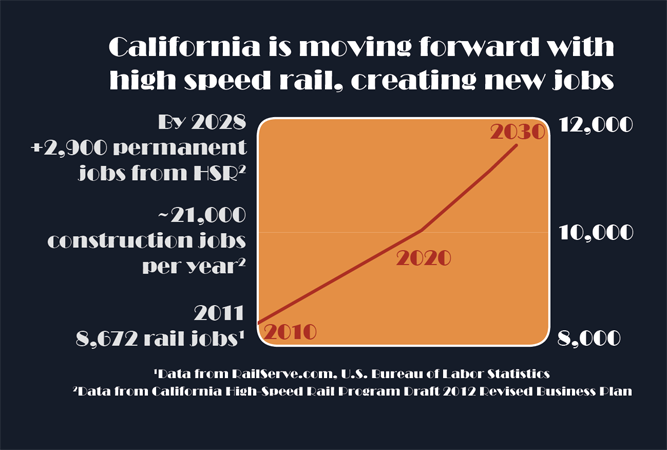
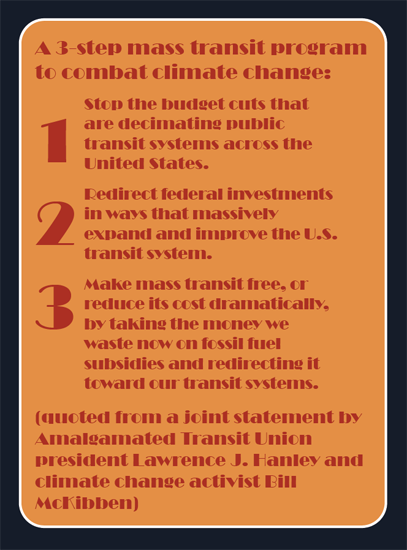
Passenger Rail in the United States: The U.S. once had the most advanced, widespread passenger rail network in the world. Our system today is a shambles, while other nations continue to make advances that put rail as the cleanest, safest, most comfortable, and in many cases fastest way to travel. High-speed rail advocates in this country have put forward proposals for decades, but keep running into a brick wall of powerful car makers and oil companies that keeps the federal subsidies to new road construction flowing. This graphic poster makes the case for a real rebuilding effort that could put a nation to work and slash our use of fossil fuels. Find a high-resolution version here.

Child Suicide: Choropleth maps are dramatic representations of data that activate visual thinking, allowing the map user to make meaning from information that would be otherwise tough to parse. Difficult problems and overlooked topics can be brought into the light of public scrutiny, creating a force for change.
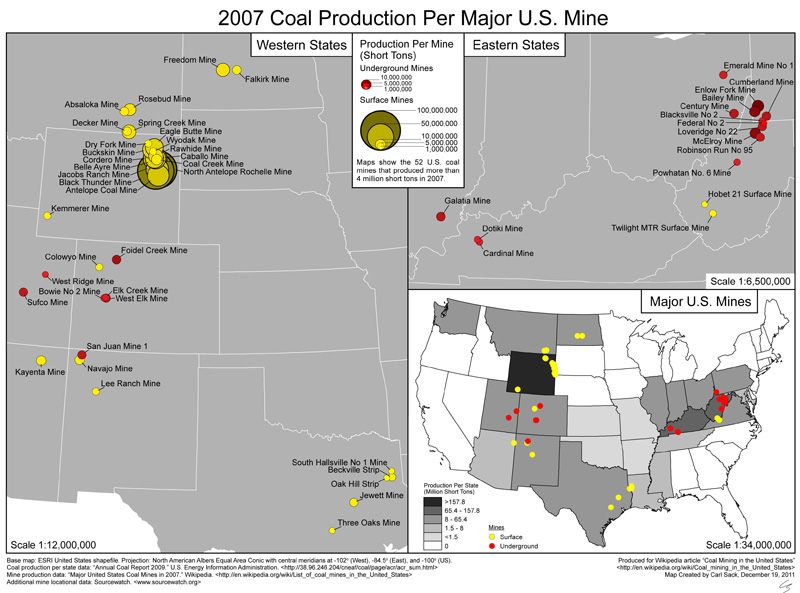
Major Coal Mines: Much scrutiny has been given to the destructive practice of mountaintop removal coal mining in Appalachia, but as I was surprised to discover while making a Wikipedia-style proportional symbol map of this dataset, the vast majority of domestically-produced coal now comes from mines in Western states. In fact, only two of the 60 most-producing coal mines are West Virginia MTR mines.

Ashland County Themes: These maps required a combination of spatial analysis operations along three different themes. I went beyond ArcGIS and added a little extra flair to them in Illustrator.

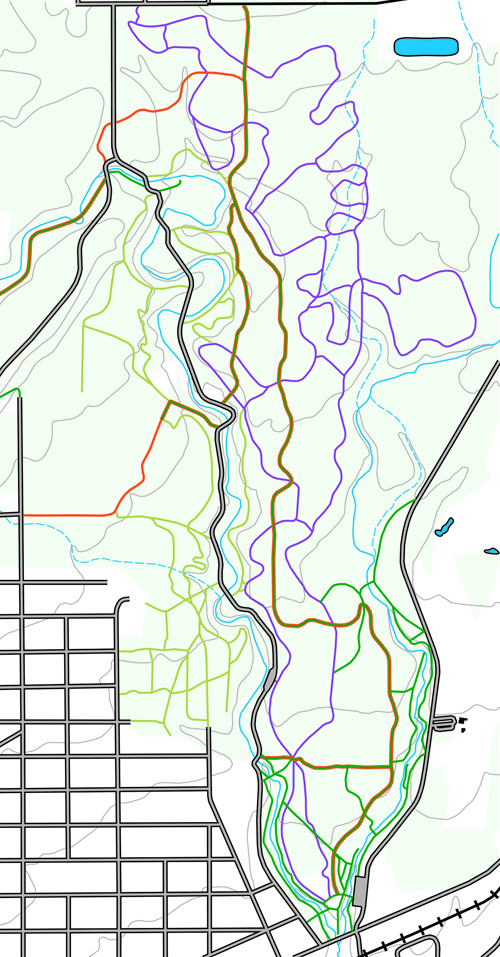
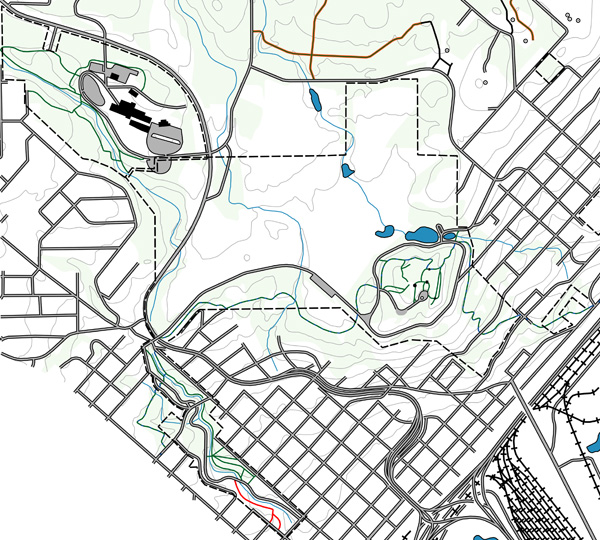
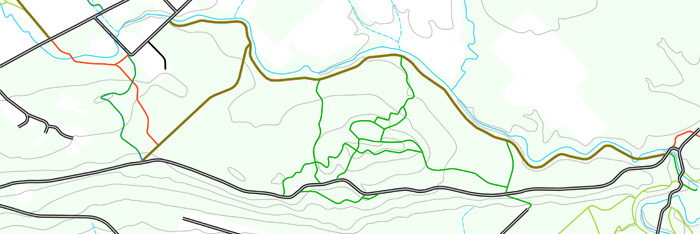
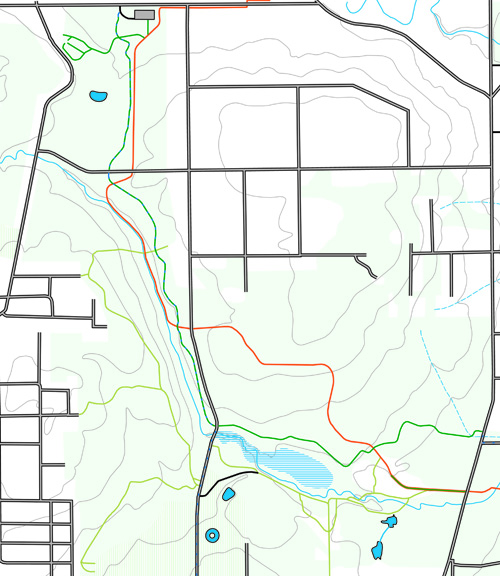
Duluth Trails: An as-yet-unfinished project predating my move to grad school, I intended to create a trail guide to Duluth, Minnesota and vicinity. This urban metropolitan area contains thousands of acres of public land ranging from developed parks to near-wilderness, and over 100 miles of nonmotorized recreation trails. I wrote descriptions and created aesthetically-pleasing maps of most of the trail systems in and around the city.
ArcGIS Online products:
While teaching full time, it can be hard to find the time needed to build a custom open-source web map. In my role at Fond du Lac Tribal and Community College, I have gotten in the habit of using Esri's ArcGIS Online ecosystem for everyday web mapping needs. Scroll down to see my earlier open-source work.
Minnesota GIS/LIS Conference Web Map: I volunteered to help create this map for the Minnesota GIS/LIS Consortium's 2022 conference in Bemidji, for which I was on the conference committee. It was a team project; credit for the lodging, dining, and attraction layers and the embedded schedule goes to St. Louis County GIS Specialist Steph Boyum.
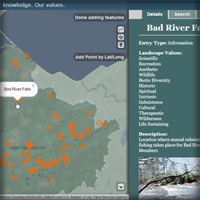
Bad River Watershed Self-Guided Tour: Community members in the Bad River Watershed who are concerned about the impacts of the Enbridge Line 5 pipeline reroute created this self-guided tour to educate the public about the uniqueness of the area and the dangers of the proposed pipeline. I volunteered to publish the tour as a story map to make it reachable by a wide audience. This work entailed building the web map in ArcGIS Online and formatting the media and text using the Story Map Builder. The tour is linked from the Communities United By Water website.
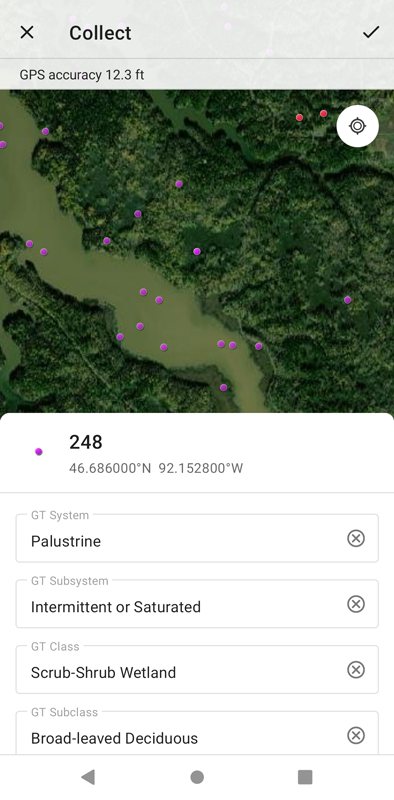
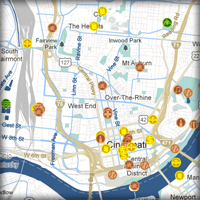
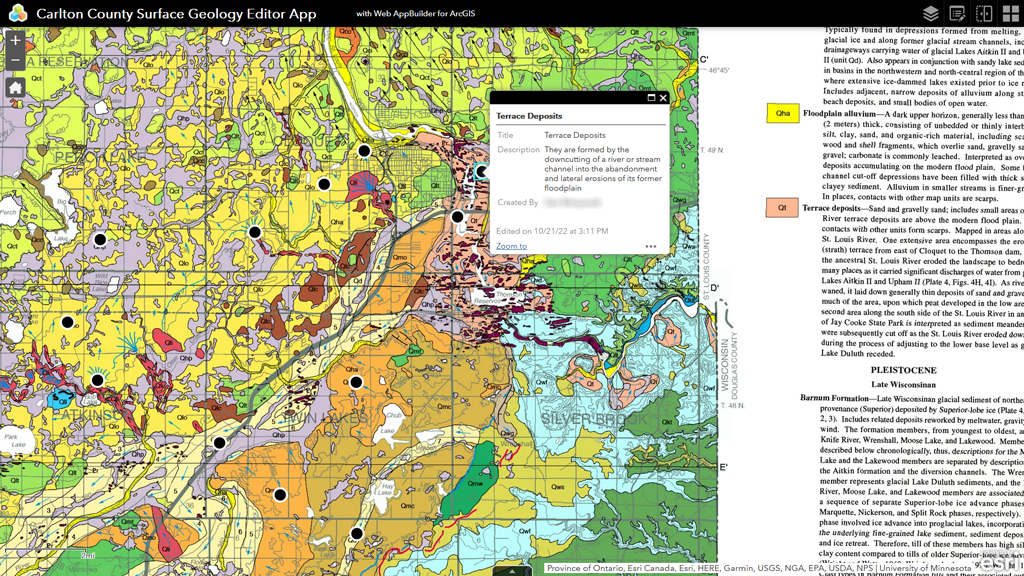
Data collection web maps: ArcGIS Online provides a platform for configuring web maps for collaborative data collection. For scientists and surveyors, these tools standardize attribute data and improve the efficiency of field data collection. For students and the public, editable web maps can enable the demonstration and contribution of their personal geographic knowledge. Click on the thumbnail image for screenshots. The first screenshot shows the Esri Field Maps app with maps I created to facilitate ground truthing for a habitat mapping project in the Lake Superior National Estuarine Research Reserve. The other screenshots show editable web maps I made for class activities I assigned, allowing students to interactively demonstrate their understandings of geography concepts. Interactive versions of these maps are not publicly accessible at this time.
Open source and custom-coded products:
MapStudy: This is a web framework I designed in grad school to allow researchers to easily create map-based survey applications for hypothesis testing. It is configurable with a wide range of interactions and design choices and collects both form input data and user interactions, storing them in a database and/or e-mailing them to the researcher directly. I constructed it with a modular MV* architecture using Backbone.js. MapStudy is an open-source project hosted on GitHub and maintained by the UW Cartography Lab.
Global Madison: This is an online, responsive situated learning application designed for the Introduction to Global Studies course at UW-Madison. Designed for mobile, it provides a browser-based guided tour of five key sites in Madison's East Isthmus for investigating changes in different aspects of the global economy from Fordist to Post-Fordist production regimes. The application was designed by a graduate seminar class in which I took part, and I completed the necessary code during the summer of 2014. The app was assigned to students in the Global Studeis course in the fall semesters of 2014 and 2015.
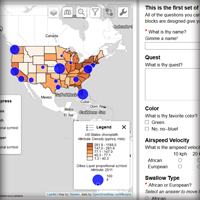
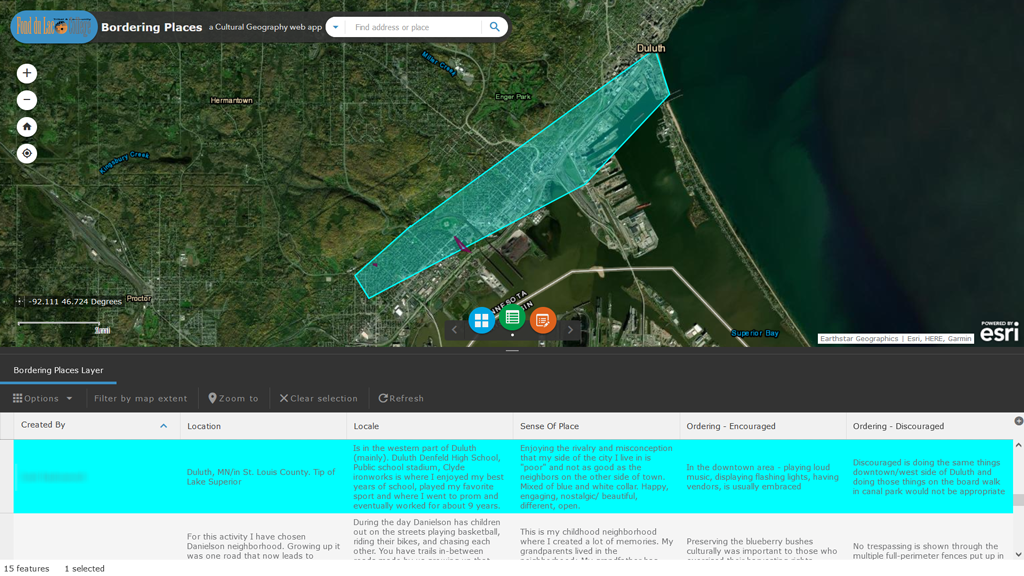
Bad River Watershed Wikimap: For my Master's Thesis project, I developed a crowdsourced web map, or 'wikimap,' of the Bad River Watershed in northern Wisconsin. The map displays features in the watershed added by users, along with user-added text, photos, audio, and video. The goal of the wikimap is to publicize the landscape values associated with places in the watershed that give those places special meaning. The map was built entirely with open-source technologies; the interface uses the Leaflet web mapping library, and the data is passed through PHP, stored in a PostGIS database, and served back to the map by Geoserver as an OGC Web Feature Service.
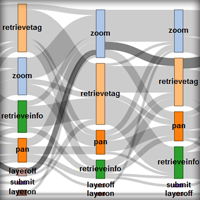
Interactive Sankey Diagrams: I created these visualizations using D3.js to explore the interactions of users with my Master's Thesis wikimap (see below). One Sankey diagram shows the frequency of all pairs of interactions performed in sequence, while the other two visualize interaction paths taken by different users through the application. These visualizations illuminated the interaction strategies of different map users.
D3 Lab Prototype: I developed this coordinated visualization example using the D3 JavaScript library, and wrote an accompanying tutorial, as a contribution to updating the UW-Madison Cartography curriculum. My work was used for the third lab in the Interactive Cartography course, replacing a former lab that relied on Adobe Flash. A later version of the prototype and tutorial was published in the cartography journal Cartographic Perspectives.
Queen City Icons: This modest class project involved creating a library of icons representing 16 distinct feature types with local significance for Cincinnatians in three broad categories. I used the Google Maps API (v3) to generate and style the map. It was both an exposition of my skills as a low-pixel-count artist and an exploration of how I make meaning of the places I think of as important in my original hometown.
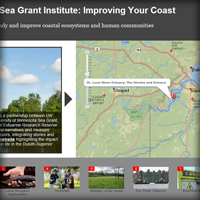
Wisconsin Sea Grant Story Map: My very first story map! I made this map tour for Wisconsin Sea Grant back in the days when Esri Story Maps were just HTML templates you could download and modify. Now gather 'round and I'll tell you about the dinosaurs I used to ride on as a kid...
I take an open approach to sharing my syllabi and course materials with others. If you would like to use any of my materials from these courses, please get in touch.


PDF Resumé — last updated 10.27.2022
PDF Curriculum Vitae — last updated 10.27.2022
Blog
Northlandia—A Blog About Maps:
My personal blog features posts about what I'm working on and learning and want to share with the world.Open Educational Resources
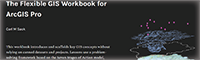
The Flexible GIS Workbook for ArcGIS Pro:
In my first couple years of teaching Intro to GIS, I assigned activities from three different Esri Press workbooks and countless online tutorials. I was unsatisfied with these materials—they used canned datasets that were not applicable to students' local geographies, recipe-like instructions that didn't explain the "why" behind the steps, and a dearth of assessment and metacognition components. An OER professional development course gave me the opportunity to start writing my own introductory GIS workbook. The workbook is project- and data-agnostic, uses the Stages of Action Model as a framework to promote procedural thinking and problem solving, and employs "teachbacks" to spur reflection and metacognition. The first two chapters have gotten good reviews from students. Eventually I hope to complete all four planned chapters and solicit peer review from other GIS educators.
Web Mapping: A Workbook for Interactive Cartography and Visualization on the Open Web:
As a grad student, I rewrote the Interactive Cartography lab curriculum at UW-Madison as a series of sequential online tutorials on web mapping using the Leaflet and D3 JavaScript libraries. These tutorials have since been maintained, expanded, and published as an OER by the UW Cartography Lab.
GIS&T Body of Knowledge: CV-15 - Web Mapping:
The Geographic Information Science and Technology Body of Knowledge is an open access encyclopedia of topics that are pertinent to GIS professionals, researchers, and educators. The original 2006 edition of the Body of Knowledge, which was mostly a list of learning standards, has been expanded into a website with article-length, peer-reviewed online entries for each topic. Given my Ph.D. dissertation research, I was asked to write the entry on web mapping.
Interactive and Multivariate Choropleth Maps with D3:
This is an older D3 tutorial I wrote for Cartographic Perspectives.Selected Articles:
For a complete list of publications, see my curriculum vitae.
Sack, CM. 2020. Talking Circle: Using GIS to Develop a Career Pathway for Tribal College Students. Tribal College: Journal of American Indian Higher Education 31(3): 46-47.
Sack, CM. 2018. The Status of Web Mapping in North American Higher Education. Cartographic Perspectives 89: 25-43. DOI: 10.14714/CP89.1429

Sack, C.M. and R.E. Roth. 2017. Design and evaluation of an Open Web Platform cartography lab curriculum. Journal of Geography in Higher Education 41(1): 1-23.
Sack C.M. 2013. User-Centered Design for Coastal Web Atlas Maps and Tools: A Process Manual. Wisconsin Coastal Atlas White Paper.
Ph.D. Dissertation:

Sack, C.M. 2018. Curriculum Development and Pedagogy for Teaching Web Mapping. Madison, WI: University of Wisconsin-Madison.
This dissertation leans on instructional design theory and empirical case studies to bridge the gap between the geospatial industry’s demand for interactive web mapping skills and the instruction of those skills within collegiate GIScience programs. It aims to point the way forward to integrating the modern web as part of the art, science, and technology of cartography and GIS.
Master's Thesis:
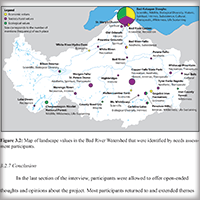
Sack, C.M. 2013. Mapmaking for Change: Online Participatory Mapping Tools for Revealing Landscape Values in the Bad River Watershed. Madison, WI: University of Wisconsin-Madison.
This research draws from the fields of GIScience and participatory development practice to examine how new Geoweb technologies might empower communities to promote their own values and agendas when faced with contentious land use issues. It tests whether crowdsourced web maps can replace or complement specialist-generated geographic information with local knowledge and landscape values.
All content on this site by Carl Sack, licensed (CC-BY-SA) except where noted otherwise.
![]()


Get that map out of here!
Let me see the whole map!
